EQUITYOPPORTUNITY

Sunday, June 30, 2024

After nearly 3 decades in stocks, what are the most important factors to increase stock-picking accuracy?

 A tough question to answer for sure, but a key word is probability. The probability that the owners inclined to sell are largely done selling at the lowered price. The probability that the price has fallen sufficiently far & fast to attract bargain-hunters sufficient to push up the price in the medium term. The probability that earnings have stabilised after a period of downdraft and are ready to rise. The probability that the macroeconomic situations that impact the stock most deeply will not worsen or even ameliorate. The probability that sufficient funds owned by technical-analysis-inclined managers will buy into the stock in a significant way and so on. And most of these play off against or with each other to produce the stock elevation or recession that eventually manifests in real time & thus furnish the profits(or not) in my own earnings statement!


However, many of these probabilities are unquantifiable: how do we go into the minds of big shareholders to know if they have no more inclination to sell?  Or into the minds of owners or prospective owners who have eyed an increase in or initiation of their stakes and are finally ready to pounce. How to assess the various factors like exchange rates & input & output prices & industry demand  in their confluencing into sales & earnings? What method is available to assess the impact of sudden outbreaks of wars and/or changes in taxation and tariffs on future earnings? Is there a guarantee that what is a comfortable cash pile now will not be whittled down by management misadventures in future, as illustrated by MAA from 2019 till 2024?


Technical analysis has helped me over the decades to cut out the necessity of over-reliance on balance sheet, earnings & cashflow figures to improve my score %. Yet less than 20% of my total wins have come from stocks bought close in time or price to their eventual bottoms and after many pricey lessons, I have come to see, for now, that fundamentals are 65%-70% dominant in price performance while technicals hold a 20-30% weight, with the two not adding up to 100% since unknowables & black swan events(with the most recent example being Covid) have a small but non-zero likelihood.

If I were to be forced to choose the single most effective technical buy signal, it would be the double bottom or quasi-double bottom, with the reliability in direct proportion to the length of time between the bottoms. Case in point is YTL Corp, which bottomed out at just under 50 sen in late 2002, rose jaggedly to a peak of M$2.11 in 2012, then meandered down to the exact nadir of 20 years prior when the Russia-UKR war broke out in Apr '22 & now trades at nearly SEVEN-FOLD, handily crushing its old record high even excluding dividends:


Wednesday, June 26, 2024

The ¥170 plus prediction I made months ago may soon come to pass!


Monday, June 24, 2024

An uncannily similar pattern to the 2012 bottoming in Tokai Senko may herald imminent rises!


A 'double bottom' in Tokai Senko (東海染工) similar to that in 2012 when the Nikkei index was dredging its 8,500 lows may just play out bullishly in the next 6 months: 12 years prior, the shares rose from a ¥770 low in Oct to ¥1,410 within 8 months, albeit at a time when the Nikkei was extremely bullish coming off a generational low, which also explains why a downward revision of the annual profit from ¥22 per share to ¥8 at year's end did not dent that rally. 

This time, the spike (circled orange) occurred when the co. announced a projected 48% increase in next year's net profit, the 4th consecutive quarter of increase starting from a reversal from a -¥40.3 loss per share in Apr-Jun '23 to ¥12.1 per share in the black in the following quarter to  ¥18.7 and finally ¥50.7 in the Jan-Mar '24 quarter, accompanied by a 1% - 17% rise in revenue for 5th successive year from '21 -'25 inclusive, reaching a forecast ¥13.9 billion yen for '24-'25, a 5% rise which brings it to just below the levels of 12 years prior.

More vitally, large shareholder Misono Service has seen its holding increase to 14.75% in Sep '23 from 14.08% in Mar '23, 11.26% in Sep '22, 10.21% in Mar '22, 9.52% in Sep '21 & a paltry 7.14% in Mar '21, representing a doubling in its stake in the last 30 months, in tandem with the co's own share buybacks which has lifted the treasury share count from 366,600 in Mar '21 to 457,400 in Sep '23 or 12.66%, making the co. its own 2nd largest owner by a country mile! The Master Trust BoJ holding has conversely dropped from 299,000 in '21 to 150,000 in Sep '23 while Mitsubishi UFJ has trimmed its stake by 1%, representing about 40,000 shares. Nisshinbo, Inabata & Nagase, textile companies that are likely its big customers hold about 3.2% each, while 2 of the chairman's family members hold almost 6% between them, leaving an estimated free-float of about 48% or 1.735 million shares, which could go as low as 44% in reality if Yashiro Kosan's holding of  3.93% is also related to the chair Yoshiaki Yashiro.

Tokai S.'s capital adequacy ratio has improved to 47% from 45% since Mar '23 & its book value has risen almost 10% in that timeframe, with operating cashflow a +ve ¥189 million & Grahamian net-net rising from -¥70.88 mil in FYE '23 to +¥156.76 million in FYE '24, equating to ¥43.4 per share. Curiously, as its NTA rose 12.39% in the last 2 years, the price dropped 27.39% out of a stable trading range of ¥1,000 to ¥1,200 that held from early '19 till late last year. It can also be clearly seen below that the stock price has roughly attained the bottoming margin of ¥500 to ¥1,000 of '98, '02-'03 & '09-'12 as well as much further back to '70-'71, meaning that its downside is likely very limited with the current projections.
 

An interesting background anecdote is that I almost bought the stock in Jan '18, predicting that its '12-'17 uptrend would continue to ¥2,000 especially after a 66% price spike in Sep '17. Fortunately, my queued price was not matched & my attention shifted to other stocks like Nomura & Mizuho.

 Dividend yield is a modest 2.4% at current levels, still over double the yen risk-free deposit rate. It's in the business of dyeing, printing & finishing textiles, including Indonesian batik patterns as well as developing & selling industrial machinery and dates back to 1941.


First conservative target is ¥999 followed by ¥1,070-1,120 within a year.


Monday, June 17, 2024

A trio of Tokyo bets defy the gravity of the Nikkei's plunge of nearly 800 points!


Japan Power Fastening, as expected, soars by its daily allowed limit, up 41.32% to rank 2nd in the % Gainers list of 1,149 stocks ( vs 2,886 losers), with less recent purchase Kuroda Precision up 11% on high volume, followed by '23 buy Daido Kogyo, up by 3% to a 52-week high!

The first is already being traded after hours at a 2nd consecutive limit UP @ ¥221.

Friday, June 14, 2024

Japan Power Fastening (日本パワーファスニング) astounds with a sudden interim dividend translating to a 16.5% yield!


Having already purchased almost exactly a year ago for ¥122I decided to average down on 31st May with a view to maximising the yield from a ¥2.50 dividend due to go ex- at the end of 2024, emboldened by a flurry of buying activity a month before that sent its price to a high of ¥166

On hindsight, that was most probably agitated by insider trading involving first recipients of leaked information of the ¥20 'dividend from surplus' due to the company's plant closure in China, in addition to news that its 24% major holder Sekisui House was selling out to a subsidiary of S & K Polytech of S. Korea, though for only ¥114 per share

After hours, the price unsurprisingly reaches limit UP at ¥171 !

Saturday, June 08, 2024

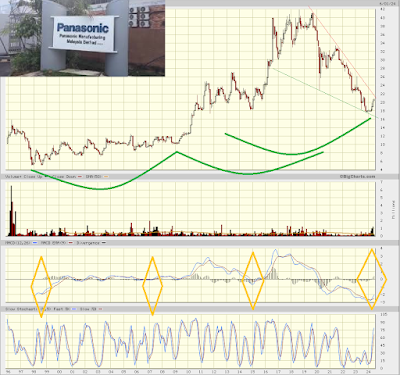
Technical (& fundamental?) reasons for the continued rise of Panasonic(M)


First target is the 0.382 Fib retracement of the fall from its '21 high of 33.40 to 17.54 = 23.60 while the next is the 0.382 Fib retracement of the drop from its all-time high of 41.90 in Aug '18 to 17.54 = 26.84, supported by the 6% dividend yield on the back of improving Y-o-Y results.


Looking at the quarterly results above, it can be seen that the market has been discounting the stock accurately, with the price back to early 2015 levels[orange-hexagoned], when its revenue was 2.8% higher & EPS 7.2% above the current FY. The peak EPS, dividend, book value & revenue are green-boxed & occurred in 4Q '21, 4Q '18, 1Q '19 & 3Q '18 respectively. Unsurprisingly, the record price was reached in the 3Q '17 till 3Q '19 timeframe, with a brief visit to $40.00 in 2Q '16, the year when the annual EPS peaked at $2.42. The 2nd highest prominent peak was a plateau-ing action between 2 Jun to 1 Jul '21, preceded by a $3 rise from $30 the week before the results encompassing the record high 75c quarter EPS & respectable $265.6 mil revenue was announced. With net profit declining 29.3% from its peak of $131 mil between '18 & '23, it remains to be seen if the trend of increasing annual EPS from 84c in '22 to 132c in '23 & 153c in '24 will continue...

However, if one may simplify: just discounting the price with the lower EPS compared the the peak number in '18 points to a 'fair price' target of $26.49.

Sale of Pintaras bought in 2023 @ $1.54 on 5th June: 


Sunday, June 02, 2024

The Japanese miracle stock makes it THREE for three!!! 👍👍👍